Your browser doesn't appear to support the HTML5 canvas element.

Monday, 24 February 2025

AN ODE W.R.T FORENSIC INFOREC

This is my current view of Vertical Information Retrieval & Large Scale Search Engines (NB. they are somewhat different!)

My Background

I first learned about local co-occurrence and traversing sorted & inverted indices as a kid at Brighton Grammar School whilst being shown how to use a proper multi-part thesaurus in the 90s, well after I had already started coding algorithms in C. So, I have been doing this Information Retrieval thing for quite a while.

In my teens I had my account banned for two weeks at RMIT University for doing too much #InfoRec experiments on Minyos. At the time everyone else was getting their accounts banned for SunOS 4.1 haxing in the Xterm labs on Yallara -- it was quite a funny situation.

Since then I've done the full postgraduate degree at RMIT on #InfoRec under the watchful eye of Professor Balbin, back when it was at its absolute peak and it was time to upgrade the world's fastest sorting/searching/filesystem algorithm (Burst Tries/HAT-Tries) again. I was yelling down the halls to Ranjan about it when he was working on it - the whole school knew what was going on, and Ranjan and I would talk regularly about the incremental improvements. I even did my own Bayesian version on the side called p̂-Tries which is 2x faster again (and which you may see someday if I feel like the world needs it).

I might have also seen some of the #InfoRec course from Stanford while I was in #SV, but that's for us to know and you to never find out ;) Their course was more focused on Search Engines than Information Retrieval, so it's nice when one gets exposed to both views.

Anyways, I do know Information Retrieval, and Search Engines, and #InfoRec; and my credentials are well established. So, this is what I currently think about #InfoRec.


Re: The ACM SIGIR Conference happening in Melbourne

I do have much to say about the NeuroPhysIIR Workshop at ACM SIGIR CHIIR 2025 conference at RMIT in Melbourne - none of the big researchers from Melbourne #InfoRec or RMIT CS&IT (RIP) are going to be there. If we aren't there is it a real conference? Is 'RMIT Computing' even a valid CS school, atm?

I certainly don't think the topics are appropriate for the current era, nor do I think it's safe for #InfoRec practitioners to be in Melbourne right now.

Please see this LinkedIn Post for more info from me on the matter.

I am unable to attend because I am trapped in my home bonded in full bondage in indentured servitude by the local police, but attendees are welcome to contact me during the conference:

  • I'm @CompSciFutures.888 on Signal Messenger or
  • ap@andrewprendergast.com if you don't care about opsec

as long as it's about #InfoRec algorithmics and not our foreign interference problem.

I am safe in the short term, but I am a little bit stuck.
As in locked in a cage stuck,
possibly in domestic + cyber imprisonment for 20 years without being told?
Anyways, I would enjoy a good chat about #InfoRec.
But don't use the normal telephony network,
because it will probably get blocked.


Edit 24-Mar-25:

I received a note from Falk (who is awsm). I don't think it changes anything I've said here, but I'm doing the right thing and posting it. I'm yet to get confirmation of attendance by researchers of significance from Melbourne InfoRec (NB. IR = InfoRec):


Thanks for your message.

You’ll be happy to know that there are in fact many senior researchers, both local and 
international, at the CHIIR conference today 😉

And just to clarify, you seem to be conflating the ACM SIGIR Conference, the ACM CHIIR
conference, and the NeuroPhysIIR workshop in your comments — these are three different
things, and not the same. (Just highlighting this since I'm sure you want to convey
correct information via your blog!) 

Regards,
Falk.

——

Falk Scholer
Professor of Information Access and Retrieval Technologies
RMIT University, Melbourne, Australia

"The Ode to 10 Blue Links":

Having worked on more than a couple large major search engines in my life (in Silicon Valley, e.g., Google & AltaVista), and having helped deal with the '98% generative' problem more than one time, I do know a thing or two about Information Retrieval, including how to do vertical search and 'Search Without a Search Box' with all the magic of Google First Page Results but without the PageRank Ergodic Markov Chain bit.

To that end, here is a little ditty, a little something I wrote about #InfoRec and ACM TREC competitions:

I am telling you this
Just so that you know.
We spiked the crap out of The Internets,
long long ago.
What you think is secret,
We already know.
Through your little input box,
We can find out anything
There is to know.
About your darkest secrets,
all of you.
LLMs, search engines,
Retrieval systems. 
Anything with an inverted index,
Our tricks work better than you know.

We are only interested in
Relative metrics,
Not causing a Punch and Judy show.
Just look after your users,
And we will go with the flow.
definitely do not psyop,
and we let almost anything else go.
Do you think we want to adjudicate,
The competition blow by blow?
Through that little search box,
We can see well into your house,
Every detailed piece of execution flow.

But we also know how to keep secret,
Whatever there is to know.
#InfoRec only talks to InfoRec
When there is something 
Important to know.
Like who is able to handle
Case sensitive nouns!
That’s something that we will show,
To our inner circle of inforec friends --
The rest of the world is not to know.
We really do love indices & InfoRec
And are much much more nerdy
About it. 
Thank you could ever possibly
Know.

We do know what we are getting into,
how much governments want the SQLs and SQRs,
those 'innermost thoughts and desires - fleeting',
is what governments want to know.
We do know what proprietary information is,
we don't ever inappropriately tell what we know.
We always do the right thing,
and stay well out of the punch and judy show.
But please pay us properly,
AND leave us, our families, our algorithms and our universities,
well well alone.
THEN we really really will,
just go with the flow.
The very very best of our algorithms,
you are yet to know.
And please never steal from us,
or the curse of 1000 years,
will soon flow.

And please do not tarnish,
or interrupt user flow.
We are telling you all of this,
because we do still know:

Users really do like to love,
the operators of the day
of their 10 blue links.

From #InfoRec, in the style of Dr. Seuss by Dr. Loose! Or is it? Ya know?


Contemporary Practical Application of #InfoRec:

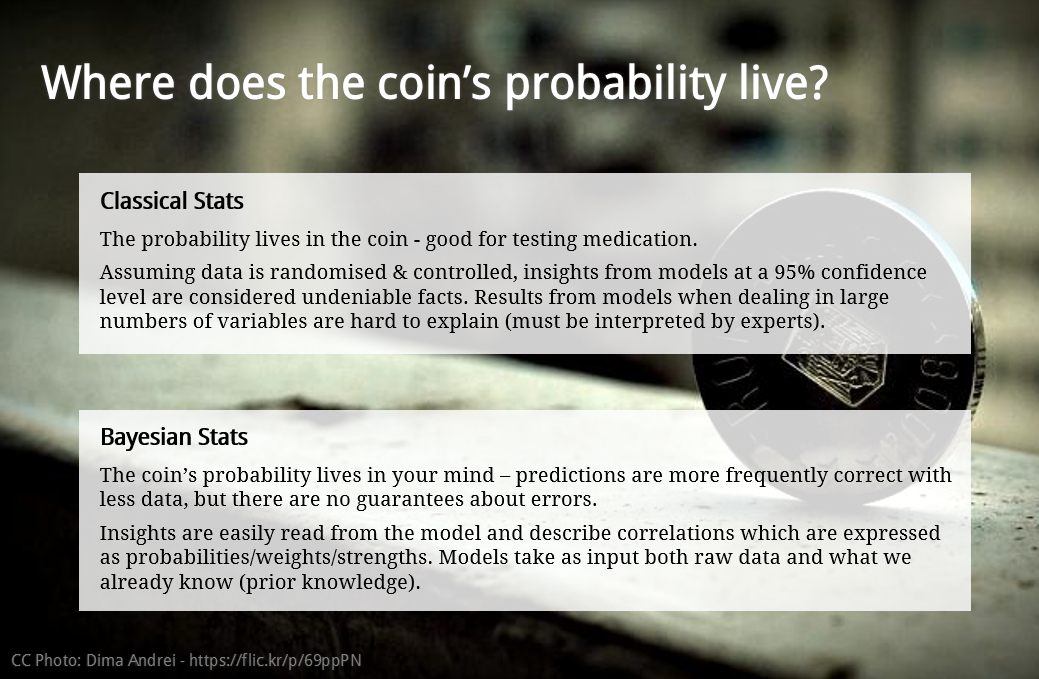
And here is how it is done - with the generalised form of the Information Retrieval Equation: 50% classical, 50% probabilistic. Just add Causality and Information Theory, for first page result like performance, just for fun:


Vizicks UI Humanizing Data Exemplar:

Here is an #InfoRec system that uses


You do need that 'Causality So Dense ...' bit in your expert system embedded in the P(relevance|x1,...,xn) piece to give it that uniquely Google First Page Results feel so that it always tells you about the datapoint you need to know about right now. For that, you are going to need a damn good Bayesian Analyst, otherwise it'll feel quite average.


Here is the showreel:


I built this for Australia Post. It was quite amazing. The socials/NPS stuff was a bit average/off (because it's hard to get the data without doing single customer view so the requirements are a bit of a moving target), but the EBIT related & paid advertising stuff was mind blowingly good. Forget data hygiene, just #InfoRec and vizualise your way through whatever you've got at the time seemed to be the outcome! It was so good, one very senior advertising executive from AdLand was on their knees begging to have it for themselves.


On Social and Economic Networks

Something to consider if you are doing non-law of large numbers, 'we live in a long tail universe' social/economic graph analysis:


On Search Query Logs

And just a reminder, on the topic of search queries (i.e., what we call SQLs & SQRs), they do contain your 'innermost thoughts and desires - fleeting'. Do we really need to keep them anymore? Why can't we absorb them into a properly privacy preserving generative model with no user IDs, then throw the logs out? That is all we need, and it will go faster!

Those SQLs & SQRs logs are the main thing governments keep targeting search engines for. If we don't have them - they should leave us alone. It's extremely expensive to run a system that keeps those logs anyway. Every government wants them, and they do end up getting them, by force if they have to. These days, their spooks, their cyber espionage and their vendor backdoors are just too hard to fight against AND get anything else done, hence why these SQLs and SQRs are now so damn expensive to keep.

We also can't ensure any guarantees that they will use them ethically in their analyses (e.g., by using loess regression) or ensure adherence to basic controls like data privacy or destruction. And then there is the matter of #InfoRec computer scientists suddenly losing family members in diabolical but oddly consistent ways -- I know a few myself personally, and have lost a father to this problem. Do we really want to be involved in that anymore?

To that end, see my Urban Dictionary entry on the topic! :)


Once upon a time Google was filled with people of the calibre that they simply wouldn't see user data when we looked at systems and we could stop governments from getting them. To us, it just wasn't there. When we see user data, what is in it, we really don't care. I really do love doing #InfoRec, and I do care about serving our users and looking after their data - always. In the most privacy preserving of ways. I say we get rid of the Search Query Logs at least - that is the one they REALLY want. Anyways, this is as close as I would ever get to them:


Banks aggregate their data at the merchant transaction and not the product level for similar reasons -- we should follow their lead. Product level transactions are even worse because they aren't 'fleeting', they are 'with conviction'.


The next Turing Award should go to 'Melbourne InfoRec'

Being identified as a significant contributor to Information Retrieval can be quite treachrous these days, and many of us have not been paid at all for our work, ranging from the fastest and most amazing algorithms in the world, to all of that work it takes to run ACM TREC competitions. We can't even safely have #InfoRec group lunches anymore.

Just to run a TREC competition requires a full university sized CS lab, filled with #InfoRec PhDs or equivalent + trained in everything from linguistics and lexicography to all the other things we need to know, including a bit of computational neuroscience here and there! Then we have a 48 hour long pizza party in the lab where we carefully class label documents, then send off the eval & held out test sets to the search engines so they can run the results. And then AFTER the competition, some more sneaky InfoRec PhD level brainiacs come in and sometimes do qualitative or quantitative forensic Information Retrieval to re-run the metrics ourselves and find out whats going on, e.g. by comparing held out test data. It is a rather large effort for all involved.

To have Search Engines not take the last one seriously is frankly, offensive. I think the last competition is possibly the last.

We really have contributed a lot and very few of us have ever been paid. There is not a chance in hell that we will ever provide a list of names. Just the existence of such a list is gravely dangerous.

To that end, I think The Association For Computing Machinery (ACM) should award the next ACM Turing Award to Melbourne InfoRec, just for being awesome. Rachel Griffiths and Cyrus should accept it on behalf of all of us. Cyrus did get his mum killed by CIA and his character smeared for detecting the inforec problem in AltaVista. The rest of us would like to stay unidentified thanks.

The award can go into the Gold Lions cupboard at Clemenger BBDO and I think Clems knows why; they do have a few job numbers that were opened up because ACM referred them to information retrievalists in the past, and they did do quite a smashing job in record time, as usual.

Long live Melbourne InfoRec!

I do love #InfoRec. And advertising. And traffic. And vizualisation. Separately. And together.

But the one thing I yearn for the most for isn't a Nobel, a Fields or a Turing: It's a *hushed tone* Gold Lion.
That's the one you really want. I know I do!

That and one free BBQ per week!! Long live RMIT CS&IT. Long live Melbourne #InfoRec.

.\𝒫

Banking clearance last updated 2023.


PS. Follow @CompSciFutures on 𝕏 to keep up-to-date on the wildest of computer science wizardry. Computer science of the ages for the ages from the ages. For ages. And more. Pass it on.


Saturday, 10 February 2024

FORTHCOMING PAPER PRESENTATION

I've just had a Marketing Science paper accepted to a conference that is happening later this year.

Abstract is:

Predicting the Performance of Digital Advertising

Andrew Prendergast
Ex. Google, Nielsen//NetRatings, BBDO.

A first principles exploration of ethically sound, privacy-preserving simulation, prediction and evaluation of campaign optimization in a digital advertising setting, including publication and description of a number of anonymised paid advertising datasets from search and display campaigns across a multitude of clients.

We analysed the practical application of performance marketing by a digital media buying team in a large advertising agency and explored challenges faced by the business school graduate level campaign analysts in predicting performance of digital advertising transacted in Vickery, silent bid and private deal settings, and explored the utility of truthful and non-truthful bidding WRT risk preferences. Our study focuses on micro-conversion based ROI optimization of direct-response search and display activity, but found that the techniques developed are also applicable to “above the line” branding focused digital campaigns. We then rigorously executed several multi-million dollar search campaigns using the developed techniques and validated the Vickery hypothesis that accurate assessment of placement valuations and truthful bidding maximises long run expected utility and campaign optimization stability.

The techniques presented include a practical approach to placement valuation & bidding which uses a simple Bayesian prior and can be calculated in Excel. We compare it’s predictive performance to more exotic models using a “poor-mans-simulation” ML model evaluation technique and find the results are competitive. The evaluation technique is presented and we demonstrate its apriori simulation of future campaign performance from past ad-server data collected aposteriori. A selection of datasets to aid in replication and improvement of our experimental results are also provided.

... and I'll finally be finishing off this old blog post series on bidding.

Should be a good show. More details to follow.

Tuesday, 14 March 2023

CURRENT STATE OF WEBGL / GLSL

If you are paying attention close enough, you might have noticed that in the background of this blog is a very simple and strightforward wave simulation using GLSL or WebGL. It has specifically been written in accordance with the OpenGL Shading Language, Second Edition [1,2] text in mind so it is compatible with every single WebGL implementation ever conceived, and is almost completely decoupled from the browser. It has some intentional 'glitch' in it, which is a reference to the analog days of Sutherland's work.

Specifically, the simulation uses a textbook implementation of GLSL, as follows:

  • GLSL 1.2
  • OpenGL ES 2.0
  • WebGL 1.0

The only coupling to the browser is the opening of a GL context, and if one clicks on the animation in the right place, an "un-project" operation that unwinds the Z-division takes place so that the fragment that underlies the mouse cursor can be calculated and the scene can be rotated using a very primitive rotation scheme which includes gimble lock (no quarternions here!). Both are extrordinarilly simple 3D graphics operations that should not affect rendering at all and is the absolute minimum level of coupling one might expect. In short, it is the perfect test of the most basic of WebGL capability.

The un-project operation is written with the minimal amount of code required and uses a little linear algebra trick to do it very efficiently. Feel free to inspect the code to see how it's done.

Current State

Update 26-Jun-23: After much trial and error, and testing on many many devices, I now have successfully isolated three separate WebGL bugs. Now that I have the three bugs properly isolated, I'm starting the writeup and hope to submit the following bug reports in the next week or two, as follows:
  1. Incorrect rendering of WebGL 1.0 scene in Google Chrome
  2. WebGL rendering heisenbug causes GL context to crash in Chrome after handling some N fragments
  3. WebGL rendering heisenbug causes GL context to incorrectly render scene after handling some N fragments
TBC...

The current state as at 14-March-2023 is that Chrome and other browsers are not able to run this animation for more than 24 hours without crashing, and on the latest versions of Chrome released early March, the animation has now slowed down to ridiculous FPS levels. Previously the animation ran at well over 30 FPS on most devices, but would crash after 24 hours.

This animation will quite happily run on an old iPad running Safari, however Chrome currently seems to be struggling. The number of vertices and the the number of sin() operations that it needs to calculate is well within the capabilities of all modern processors, including those found in i-devices such as phones and tablets on which one can play a typical game.

Example of correct rendering on all modern browsers including Safari on iPad

Example of incorrect rendering on Chrome 111.0.5563.111 (64-bit) as at 23-Mar-23

Brave Browser (based on Chromium) renders correctly, but is horrendously slow in the GA branch (Beta currently works fine). I'm not sure if this is a Linux vs. Windows issue or discrete vs. embedded GPU at this stage, will investigate further when I have time.

NB. As at 14-March-2023, on Brave Browser 1.49.120 on Windows with a Discrete GPU the simulation struggles to render 5 FPS, and on Brave Browser 1.50.85 (beta) on Linux with an embedded GPU it works OK, but I can point to other vizualisation artefacts elsewhere that 1.50.85 cannot handle (but which previous versions of Brave/Chrome could), for example, on the homepage of vizdynamics.com, the Humanized Data Robot should gently move around the screen with a slight parallax effect if one moves the mouse over it. Why is the rendering engine in Chrome suddenly regressing, and why is it not using the GPU? This wave simulation should be able to run in it's entirety on SIMD architecture and the Humanized Data Robot used to be rendering flawlessly. What is going on?

At 30 FPS, the wave simulation requires around 75 MFLOPS of processing power. To put that into perspective, the first Sun Microsystems SPARC Station released in 1989 was able to calculate 16.2 MIPS (similar to MFLOPS), and the SPARC Station 2 (released 1991) could calculate nearly 30 MIPS. That was over 30 years ago, and a SPARC Station 2 machine had enough compute power that it could happily calculate the same wave simulation at around 10-15 FPS without vizualising it, but actually at 2-5 FPS once one implements a GPU pipeline (thank god SGI bought out IRIS GL).

I still have my copy of the original OpenGL Programming Guide (1st edition, 6th printing) that came with my Silicon Graphics Indy workstation. It was a curious book, and I implemented my first OpenGL version of these wave simulations in 1996 according to it, so I'm quite familiar with what to expect. An Indy could handle this - with a bit of careful tuning - quite well. The hardness of this vizualisation is the tremendous number of sin() operations, and the cosine()s used to take their derivative, so it really does test the compute power of a graphics pipeline quite well - if the machine or the implementation isn't up to it, these calculations will bring it to it's knees quite quickly.

Fast-forward to 2023, and a basic i7 cannot run the simulation at 30FPS! To put things into perspective, a 2010 era Intel i7 980 XE is capable of over 100 GFLOPS (about 1000x more processing power than whats required to do 75 MFLOPS), and that's without engaging any discrete or integrated SIMD GPU cores. Simply put, the animation in the background of this blog should be trivial for any computing device available today, and should run without interruption.

Lets see how well things progress through March and if things improve.

Update 30-Jan-24: Adding an FFT to make the wave simulation faster makes the problem go away, or potentially causes it to take longer to crash. Dunno. Have asked the Brave team to look into it:

References

[1] Rost, Randi J., and John M. Kessenich. OpenGL Shading Language. 2nd ed. Addison-Wesley, 2006. OpenGL 2.0 + GLSL 1.10

[2] Shreiner, Dave. OpenGL Programming Guide the Official Guide to Learning OpenGL, Version 2. 5th ed. Upper Saddle River, NJ u.a: Addison-Wesley, 2006.

Saturday, 4 March 2023

YOU ARE ALL IN A VIRTUAL

I love Urban Dictionary - watch out for my @CompSciFutures updates. Here's one I posted today:

This is actually a commentary on attack surfaces, specifically that back in the day, one's lead architect knew the entirety of a system's attack surface and would secure it appropriately. Today, systems are so complex, that no single man knows the entire intricacies of the attack surface for even just a small web application with an accompanying mobile app. The security implications of this are profound, hence the reason why I am writing a textbook on the topic.

Link to more Urban Dictionary posts in the footer.

Tuesday, 21 February 2023

SOFTWARE ENGINEERING MANUAL OF STYLE, 3RD EDITION

My apologies to everyone I was supposed to follow up with in January - I've been writing a textbook. I'll get back to you late February/early March, I'm locking down and getting this done so we can address the systemic roots of this ridicuous cyber security problem we have all found ourselves in.

The book is called:

The Software Engineering Manual of Style, 3rd Edition
A secure by design, secure by default perspective for technical and business stakeholders alike.

The textbook is 120 pages of expansion on a coding style guide I have maintained for over 20 years and which I hand to every engineer I manage. The previous version was about 25 pages, so this edition is a bit of a jump!

Secure-by-design, secure-by-default software engineering. The handbook.

It covers the entirety of software engineering at a very high level, but has intricate details of information security baked into it, including how and why things should be done a certain way to avoid building insecure technology that is vulnerable to attack. Not just tactical things, like avoiding 50% of buffer overruns or most SQL injection attacks (and leaving the rest of the input validation attacks unaddressed). This textbook redefines the entire process of software engineering, from start to finish, with security in mind from page 1 to page 120.

Safe coding and secure programming are not enough to save the world. We need to start building technology according to a secure-by-design, secure-by-default software engineering approach, and the world needs a good reference manual on what that is.

This forthcoming textbook is it.

Latest Excerpts

21-Feb-23 Excerpt: The Updated V-Model of Software Testing
(DOI: 10.13140/RG.2.2.23515.03368)

21-Feb-23 Excerpt: The Software Engineering Standard Model
(DOI: 10.13140/RG.2.2.23515.03368)

EDIT 22-Mar-23: Proof showing that usability testing is no longer considered non-functional testing
(DOI: 10.13140/RG.2.2.23515.03368)

EDIT 22-Mar-23: The Pillars of Information Security, The attack surface kill-switch riddle +
The elements of authenticity & authentication (DOI: 10.13140/RG.2.2.12609.84321)

EDIT 22-Apr-23: The revised Iterative Process of Modelling & Decision Making
(DOI: 10.13140/RG.2.2.11228.67207/1)

EDIT 18-May-23: The Lifecycle of a Vulnerability
(DOI: 10.13140/RG.2.2.23428.50561)


Audience

I'm trying to write it so it's processes and methodologies:

  • Can be baked into a firm by CXOs using strategic management principles; or
  • embraced directly by engineers and their team leaders without the CEOs shiny teeth and meddlesome hands getting involved.

Writing about very technical matters for both audiences is hard and time consuming, but I think I'm getting the hang of it!

Abstract from the cover page

The foreword/abstract from the first page of the text reads as follows:

"The audience of this textbook is engineering based, degree qualified computer science professionals looking to perfect their art and standardise their methodologies and the business stakeholders that manage them. This book is not a guide from which to learn software engineering, but rather, offers best practices canonical guidance to existing software engineers and computer scientists on how to exercise their expertise and training with integrity, class and style. This text covers a vast array of topics at a very high level, from coding & ethical standards, to machine learning, software engineering and most importantly information security best practices.

It also provides basic MBA-level introductory material relating to business matters, such as line, traffic & strategic management, as well as advice on how to handle estimation, financial statements, budgeting, forecasting, cost recovery and GRC assessments.

Should a reader find any of the topics in this text of interest, they are encouraged to investigate them further by consulting the relevant literature. References have been carefully curated, and specific sections are cited where possible."

The book is looking pretty good: it is thus far what it is advertised to be.

Helping out and donating

The following link will take you to a LinkedIn article that I am publishing various pre-print extracts (some are also published above).

If you are in the field of computer science or software engineering, you might be able to help by providing some peer-review. If not, there is a link to an Amazon booklist that you can also contribute to this piece of work by donating a book or two.

And feel free just to take a look and see where we're going and what's being done to ensure that moving forward, we stop engineering such terribly insecure software. Any support to that end would be most appreciated.

Edited 22-Mar-23: added usability testing proof
Edited 22-Mar-23: added Pillars of Cybersecurity

Sunday, 1 January 2023

VIZLAB 2.0 CLOSURE

VizDynamics is still a trading entity, but VizLab 2.0 is now closed. The lack of attention to 'cybersecurity' [sic] by state actors, big tech and cloud operators globally made it impossibly difficult to continue operating an advanced computer science lab with 6 of Melbourne's best computer scientists supporting corporate Australia. We could have continued, but we saw this perfect storm of cyber security coming and decided to dial down VizLab starting in 2017. Given recent cyber disasters, it is clear we made the right decision.

State actors, cloud operators and big tech need to be careful with “vendor backdoor” legislation such as key escrow of encryption, because this form of 'friendly fire' hides the initial attack vector and the intial point of network contact when trying to forensically analyse and close down real attacks. Whilst that sort of legislation is in place without apporpriate access controls, audit controls, detective controls, cross-border controls, kill switches and transparency reporting, it is not commercially viable for us to operate a high powered CS lab, because all the use cases corporate Australia want us to solve involve cloud-based PII, for example, ‘Prediction Lakes’.

A CS Lab designed for paired programming

Part MIT Media lab, part CMU Autonlab, part vizualistion lab, part paired-programming heaven: this was VizLab 2.0.

VizLab doorway with ingress & egress Sipher readers, Inner Range high frequency monitoring & enterprise class CCTV.
A secure site in a secure site.


A BSOD in The Lab: The struggles of vendor backdoors + WebGL and 3D everywhere.
Note the 3-screen 4k workstation in the foreground designed
for paired local + remote programming.


The Lab - Part vizualisation, part data immersion. VizLab 2.0.
Note the Eames at the end of the centre aisle and the Tom Dixon in the foreground.


Each workstation was setup for paired programming but with a vibe like it's an ad agency studio. 6 workstations w/ 6-9 fully traffic managed engineers in rotation, where you could plug in 2 keyboards, 2 mice, 2 chairs side-by-side and enough room so that you weren't breathing on eachother with returns either side big enough for a plethora of academic texts, client specs and all the notes you could want. With 2 HDMI cables hung from the roof linking to projectors on opposing walls that could reach any workstation at any moment, this was an environment for working on hard things; collaboratively, together.

Note the lack of client seating. They would have to perch on the edge of a desk and see everything, or an Eames lounge at the end of the room and try to see everything, or a White real leather Space Furniture couch next to a Tom Dixon and see nothing - we took host to management teams from a plurality of ASX200s, and the first thing that struck them — we didn't have seating for them, because the next few hours they were going to be moving around and staring at walls, computers, the ceiling — there simply was nowhere to sit, when a team of computer scientists, trained in computer graphics and very deft with data science were taking them on a journey into Data.

The now: VizLab 3.0 – The future: VizLab 4.0

AP is still around and is spending the most part of 2023 writing a textbook on secure software engineering, and we've setup a smaller two-man VizLab 3.0 for cyber defence research mainly around GRC assessment and computer science education both at a secondary and a tertiary level. AP is currently doing research in that field so we can hopefully reduce cyber-risk down to a level that is acceptable to coprorate Australia by increasing the mathematical and cyber-security awareness and literacy of computer science students as they enter into university and then industry.

If we can help to create that environment, then VizLab 4.0 may materialise and will be bigger and better, but because we dialed back our insurances (it's not practical to be paying $25K pa while we're doing research), we aren't in a position to provide direct consultation services at the moment. VizDynamics is still a trading entity, and a new visualisation based Information Security brand might be launched somewhere in 2024 based on the “Humanizing Data” vizualisation thesis (perhaps through academia or government – we’re not sure yet). Fixes are happening to WebGL rendering engines, and slowly cyber security awareness is rising to the top of the agenda, so our work is slowly shifting the needle and we’re moving in the right direction.

If you want to keep track of what AP's up to, vizit blog.andrewprendergast.com.

Saturday, 5 November 2022

THE MIND BLOWING HARBINGER OF WIRED 1.01

Wired magazine 1.01 was published in 1993 by Nicholas Negreponte & Louis Rosetto.

Every issue contained inside the front cover a 'Mind Grenade', and the one from the very first issue (1.01) is -- in hindisght -- creepy. Here it is:

The 'mind grenade' from Wired 1.01, Circa March 1993.

Damn Professor Negroponte, you ring truer every day.

Friday, 21 October 2022

RECOMMENDER SYSTEMS

Recommender systems are huge outside of Australia and USA such that most marketing managers now consider their optimisation as important as Search Engine Marketing (SEM). I can't believe we have totally missed the ball on this one, and nobody on the other side of planet, from Dubai to London has bothered to tell us!

Anwyays, here's the original seminal paper that Andreas Wiegend (ex Stanford, market genius and inventor of Prediction Markets and The BRIC Bank, Chief Scientist Emeritus of Amazon.com and inventor of recommender systems) directed and promoted this paper. It's based on proper West Coast Silicon Valley AI, with a quality discussion about a number of related techologies and market related effects that impact recommender systems.

Enjoy!

Sunday, 17 July 2022

I LOVE FOURIER DOMAIN

I've been playing with building a Swarm Intelligence simulator based on a fourier domain discretisation to schedule the placement of drones in 3D space and cars in 2D space. Here's a little video demo of it's basic structure in action, on top of this is some differential equations to capture the displacement field, then drone position coords:


LinkedIn post with a video demo of the simulator in structural mode.
You need to be logged into LinkedIn to see the post.


If you want to have a play with this class of sine wave, you might notice a simpler simulation in the background of this blog. It has a few extra features not normally seen of these types of simulation: instead of a single point being able to move along one axis (usually the Y-axis), every point in my simulation can move anywhere along the X, Y or Z axis. Take a look yourself, left-click and drag the mouse on the background (where the 3D simulation is happening) to rotate the simulation in realtime. Look below the surface to see the mesh, above it and you get a flat view. 

For best effect, try full-screen browser, remove all content and view just the background wave simulation.

Sunday, 31 March 2019

MY FAVOURITE VIZ OF ALL TIME

How Google used vizualisation to become one of the worlds most valuable companies

At VizDynamics we have done a lot of 'viz'-ualisation, so I’ve seen more than several life-times worth of dashboards, reports, KPIs, models, metrics, insights and all manner of presentation and interaction approaches thereof.

Yet one Viz has always stuck in my mind.

More than a decade ago when I was post start-up exit and sitting out a competitive-restraint clause, I entertained myself by travelling the world in search of every significant thought leader and publication about probabilistic reasoning that I could find. Some were very contemporary; others were most ancient. I tried to read them all.


A much younger me @ the first Googleplex (circa 2002)

Some of this travelling included regular visits to Googleplex 1.0, back before they floated and well before anyone knew just how much damn cash they were making. As part of these regular visits, I came across a viz at the original ‘Plex that blew me away. It sat in a darkened hall in a room full of engineers on a small table at the end of a row of cubicles. On this little IBM screen was an at-the-time closely guarded viz:

The "Live Queries" vizualisation @ Googleplex 1.0

Notice the green data points on the map? They are monetised searches. Notice the icons next to the search phrases? More “$” symbols meant better monetisation. This was pre-NPS, but the goal was the same – link $ to :) then lay it bare for all to see.

What makes this unassuming viz so good?

It's purpose.

Guided by Schmidt’s steady hand, Larry & Sergey (L&S) had amassed the brainpower of 300+ world leading engineers, then unleashed them by allowing them to work independently. They now needed a way for them to self-govern and -optimise their continual improvements to product & revenue whilst keeping everyone aligned to Google's users-first mantra.

The solution was straightforward: use vizualisation to bring the users into the building for everyone to see, provide a visceral checkpoint of their mission and progress, and do it in a humanely digestible manner.

Simple in form & embracing of Tufteism, the bottom third of the screen scrolled through user searches as they occurred, whilst the top area was dedicated to a simple map projection showing where the last N searches had originated from. An impressively unpretentious viz that let the Data talk to one’s inner mind. The pictograph in the top section was for visual and spatially aware thinkers, under that was tabular Data for the more quantitative types. And there wasn’t a single number or metric in sight (well not directly anyway). Three obviously intentional design principles executed well.

More than just a Viz, this was a software solution to a plurality of organizational problems.

To properly understand the impact, imagine yourself for a moment as a Googler, briskly walking through the Googleplex towards your next meeting or snack or whatever. You alter your route slightly so you can pass by a small screen on your way through. The viz on the screen:

  • instantly and unobtrusively brought you closer to your users,
  • persistently reminded you and the rest of the (easily distracted) engineers to stay focused on the core product,
  • provided constant feedback on financial performance of recent product refinements, and
  • inspired new ideas

before you continued down the hall.

The best vizualisations humanise difficult data in a visceral way

This was visual perfection because it was relevant to everyone, from L&S down to the most junior of interns. Every pixel served a purpose, coming together into an elegantly simple view of Google's current state. Data made so effortlessly digestible that it spoke to one’s subconscious mind with only a passing glance. A viz so powerful that it helped Google to become one of the world’s most valuable companies. This was a portal into people's innermost thoughts and desires as they were typing them into Google. All this... on one tiny little IBM screen, at the end of a row of cubicles.

Thursday, 1 June 2017

ACLAND STREET – THE GRAND LADY OF STKILDA

Acland Street is the result of two years of research. As well as extended archival and social media research, more than 150 people who had lived, worked, and played in Acland Street were interviewed to reveal its unique social, cultural, architectural, and economic history.

Of course we got a mention on page 133:

Note the special mention under 'The Technology', page 133. Circa 1995, published 2017.

Tuesday, 1 September 2015

CXO LEADERS SUMMIT

Homepix Photography-351

Thursday, 30 October 2014

INTRO TO BAYESIAN REASONING LECTURE

Here's a quick one to make the files available online from today's AI lecture at RMIT University. Much thanks to Lawrence Cavedon for making it happen.


Downloads

Have fun and feel free to email me once you get your bayes-nets up and running!

Thursday, 16 October 2014

ACCESSING DATA WAREHOUSES WITH MDX RUNNER


It's always good to give a little something back, so each year I do some guest lecturing on data warehousing to RMIT's CS Masters students.

We usually pull a data warehouse box out of our compute cloud for the session so I can walk through the whole end-to-end stack from the hardware through to the dashboards. The session is quite useful and always well received by students.


This year the delightful Jenny Zhang and I showed the students MDX Runner, an abstraction used at VizDynamics on a daily basis to access our data warehouses. As powerful as MDX is, it has a steep learning curve and the result sets it returns can be bewildering to access programmatically. MDX Runner eases this pain by abstracting out the task of building and consuming MDX queries.

Given that it has usefulness far beyond what we do at VizDynamics, I have made arrangements for MDX Runner to be open-sourced. If you are running analysis services or any other MDX-compatible data warehousing environment, take a look at mdxrunner.org - you will certainly find it useful.

Do reach out with updates if you test it against any of the other BI platforms. Hopefully over time we can start building out a nice generalised interface into Oracle, Teradata, SAP HANA and SSAS.


Saturday, 13 September 2014

BIDDING: AXIOMS OF DIGITAL ADVERTISING + TRAFFIC VALUATION

In this post I share a formal framework for reasoning about advertising traffic flows, is how black box optimisers work and needs to be covered before we get into any models. If you are a marketer, then the advertising stuff will be old-hat and if you are a data scientist then the axioms will seem almost obvious.

What is useful is combining this advertising + science view and the interesting conclusions about traffic valuation one can draw from it. The framework is generalised and can be applied to a single placement or to an entire channel.

Creative vs. Data – Who will win?

I should preface by saying my view on creative is that it is more important than the quality of one's analysis and media buying prowess. All the data crunching in the world is not worth a pinch if the proposition is wrong or the execution is poor.

On the other hand, an amazing ad for a great product delivered to just the right people at the perfect moment will set the world on fire.

Problem Description

The digital advertising optimisation problem is well known: analyse the performance data collected to date and find the advertising mix that allocates the budget in such a way that maximises the expected revenue.

This can be divided into three sub-problems: assigning conversion probabilities to each of the advertising opportunities; estimating the financial value of advertising opportunities; and finding the Optimal Media Plan.

The most difficult of these is the assessment of conversion probabilities. Considering only the performance of a single placement or search phrase tends to discard large volumes of otherwise useful data (for example, the performance of closely related keywords or placements). What is required is a technique that makes full use of all the data in calculating these probabilities without double-counting any information.

The Holy Triumvirate of Digital Advertising

In most digital advertising marketplaces, forces are such that traffic with high conversion probability will cost more than traffic with a lower conversion probability (see Figure 1). This is because advertisers are willing to pay a premium for better quality traffic flows while simultaneously avoiding traffic with low conversion probability.

Digital advertising also possesses the property that the incremental cost of traffic increases as an advertiser purchases more traffic from a publisher (see Figure 2). For example, an advertiser might increase the spend on a particular placement by 40%, but it is unlikely that any new deal would generate an additional 40% increase in traffic or sales.

Figure 1: Advertiser demand causes the cost of traffic to increase with conversion probability

Figure 2: Publishers adjust the cost of traffic upward exponentially as traffic volume increases

To counter this effect, sophisticated marketers grow their advertising portfolios by expanding into new sites and opportunities (by adding more placements), rather than by paying more for the advertising they already have. This horizontal expansion creates an optimisation problem: given a monthly budget of $x, what allocation of advertising will generate the most sales? This configuration then is the Optimal Media Plan.

Figure 3: The Holy Triumvirate of Digital Advertising: Cost, Volume and Propensity

NB: There are plenty of counterexamples when this response surface is observed in the wild. For example with Figure 2, some placements are more logarithmic than exponential, while others are a combination of the two. A good agency spends their days navigating and/or negotiating this so that one doesn't end up over paying.

To solve the Optimal Media Plan problem, one needs to know three things for every advertising opportunity: the cost of each prospective placement; the expected volume of clicks; and the propensity of the placement to convert clicks into sales (see Figure 3). This Holy Triumvirate of Digital Advertising (cost, volume and propensity) is constrained along a response surface that ensures that low cost, high propensity and high volume placements occur infrequently and without longevity.

For the remainder of this post (and well into the future), propensity will be considered exclusively in terms of ConversionProbability. This post will provide a general framework for this media plan optimisation problem and explore how ConversionProbability relates to search and display advertising.

Saturday, 22 March 2014

A GRAND THESIS

ProbabilisticLogic.AI homepage

Oh dear, the game is up. Our big secret is out. We should have a parade.

The Future of Modernity

This year is looking like when computer scientists come out and confess that the world is undergoing a huge technology driven revolution based on simple probabilities. Or perhaps it's just that people have started to notice the rather obvious impact it is making on their lives (the hype around the recent DARPA Robotics Challenge and Christine Lagarde's entertaining lecture last month are both marvelous example of that).

This change is to computer science what quantum mechanics was to physics: a grand shift in thinking from an absolute and observable world to an uncertain and far less observable one. We are leaving the digital age and entering the probabilistic one. The main architects of this change are some very smart people and my favorite super heroes - Daphne Koller, Sebastian Thrun, Richard Neapolitan, Andrew Ng and Ron Howard (no not the Happy Days Ron – this one).

Behind this shift are a clique of innovators and ‘thought leaders’ with an amazing vision of the future. Their vision is grand and they are slowly creating the global cultural change they need to execute it. In their vision, freeways are close to 100% occupied, all cars travel at maximum speed and the population growth declines to a sustainable level.

This upcoming convergence of population to sustainable levels will not come from job-stealing or killer robots, but from increased efficiency and the better lives we will all live, id est, the kind of productivity increase that is inversely proportional to population growth.

And then world is saved... by computer scientists.

What is it sort of exactly-ish?

Classical computer science is based on very precise, finite and discrete things, like counting pebbles, rocks and shells in an exact manner. This classical science consists of many useful pieces such as the von-neumann architecture, relational databases, sets, graph theory, combinatorics, determinism, greek logic, sort + merge, and so many other well defined and expressible-in-binary things.

What is now taking hold is a whole different class of computer-ey science, grounded in probabilistic reasoning and with some other thing called information theory thrown in on the sidelines. This kind of science allows us to deal in the greyness of the world. Thus we can, say, assign happiness values to whether we think those previously mentioned objects are in fact more pebbly, rocky or shelly given what we know about the time of day and its effect on the lighting of pebble-ish, rock-ish and shell-ish looking things. Those happiness values are expressed as probabilities.

The convenience of this probability-based framework is its compact representation of what we know, as well as its ability to quantify what we do not(ish).

Its subjective approach is very unlike the objectivism of classical stats. In classical stats, we are trying to uncover a pre-existing independent, unbiased assessment. In the Bayesian or probabilistic world bias is welcomed as it represents our existing knowledge, which we then update with real data. Whoa.

This paradigm shift is far more general than just the building of robots - it's changing the world.

I shall now show you the evidence so you may update your probabilities

A testament to the power of this approach is that the market leaders in many tech verticals already have this math at their heart. Google Search is a perfect example - only half of their rankings are PageRank based. The rest is a big probability model that converts your search query into a machine-readable version of your innermost thoughts and desires (to the untrained eye it looks a lot like magic).

If you don’t believe me, consider for a moment, how does Facebook choose what to display in your own feed? How do laptops and phones interpret gestures? How do handwriting, speech and facial recognition systems work? Error Correction? Chatbots? Emotion recognition? Game AI? PhotoSynth? Data Compression?

It’s mostly all the same math. There are other ways, which are useful for some sub-problems, but they can all ultimately be decomposed or factored into some sort of Bayesian or Markovian graphical probability model.

Try it yourself: Pickup your iPhone right now and ask the delightful Siri if she is probabilistic, then assign a happiness value in your mind as to whether she is. There, you are now a Bayesian.

APAC is missing out

Notwithstanding small pockets of knowledge, we don’t properly teach this material in Australia, partly because it is so difficult to learn.

We are not alone here. Japan was recently struck down by this same affliction when their robots could not help to resolve their Fukushima disaster. Their classically trained robots cannot cope with changes to their environment that probabilities so neatly quantify.

To give you an idea of how profound this thesis is, or how far and wide it will eventually travel, it is currently taught by the top American universities across many faculties. The only other mathematical discipline that has found its way into every aspect of science, business and humanities is the Greek logic, and that is thousands of years old.

A neat mathematical magic trick

The Probabilistic Calculus subsumes Greek Logic, Predicate Logic, Markov Chains, Kalman Filters, Linear Models, possibly even Neural Networks; that is, because they can all be expressed as graphical probability models. Thus logic is no longer king. Probabilities, expected utility and value of information are the new general purpose ‘Bayesian’ way to reason about anything, and can be applied in a boardroom setting as effectively as in the lab.

One could build a probability model to reason about things like love, however it's ill advised. For example, a well-trained model would be quite adept at answering questions like “what is the probability of my enduring happiness given a prospective partner with particular traits and habits.”

The ethical dilemma here is that a robot built on the Bayesian Thesis is not thinking as we know it – it's just a systematic application of an ingenious mathematical trick to create the appearance of thought. Thus for some things, it simply is not appropriate to pretend to think deeply about a topic; one must actually do it.

We need bandwidth or we will devour your 4G network whole

These probabilistic apps of the future (some of which already exist) will drive bandwidth-hogging monsters (quite possibly literally) that could make full use of low latency fibre connections.

These apps construct real-time models of their world based on vast repositories of constantly updated knowledge stored ‘in the cloud’. The mechanics of this requires the ability to transmit and consume live video feeds, whilst simultaneously firing off thousands of queries against grand mid- and big-data repositories.

For example, an app might want to assign probabilities to what that shiny thing is over there, or if its just sensor noise, or if you should buy it, or if you should avoid crashing into it, or if popular sentiment towards it is negative; and, oh dear, we might want to do that thousands of times per second by querying Flickr, Facebook and Google and and and. All at once. Whilst dancing. And wearing a Gucci augmented reality headset, connected to my Hermes product aware wallet.

This repetitive probability calculation is exactly what robots do, but in a disconnected way. Imagine what is possible once they are all connected to the cloud. And then to each other. Then consider how much bandwidth it will require!

But, more seriously, the downside of this is that our currently sufficient 4G LTE network will very quickly be overwhelmed by these magical new apps in a similar way to how the iPhone crushed our 3G data networks.

Given that i-Devices and robots like to move around, I don't know whether FTTH would be worth the expense, but near-FTTH with a very high performance wireless local loop certainly would help here. At some point we will be buying Hugo Boss branded Occulus Rift VR headsets, and they need to plug into something a little more substantive than what we have today.

Ahh OK, what does this have to do with advertising?

In my previous post I said I would be covering advertising things. So here it is if you haven't already worked it out: this same probability guff also works with digital advertising, and astonishingly well.

There I said it, the secret is out. Time for a parade.

...some useful bits coming in the next post.

Friday, 21 March 2014

OH HAI

Fab, I’m blogging.

A Chump’s Game

A good friend of mine, whilst working at a New York hedge fund once said to me, “online advertising is a chump’s game”.

At the time he was exploring the idea of constructing financial instruments around the trade of user attention. His comment was coming from just how unpredictable, heterogeneous and generally intractable the quantitative side of advertising can be. Soon after, he quickly recoiled from the world of digital advertising and re-ascended back into the transparent market efficiency of haute finance; a world of looking for the next big “arb”.

What I Do

I am a data scientist and I work on this problem every day.

Over the last 15 or so years I have come to find that digital advertising is, in fact, completely the opposite of a chump's game – yes, media marketplaces are extraordinarily opaque and highly disconnected – but with that comes fantastically gross pricing inefficiencies exploitable in a form of advertising arbitrage.

The Wall Street guys saw this, but never quite cracked how to exploit it.

What you will find here

If you have spent more than a little time with me, then in between mountain biking and heli-boarding at my two favorite places in the world, you will have probably heard about or seen a probability model or two.

In the coming months I will be banging on about some of this, and in particular sharing a few easy tricks on how advertisers can use data to gain a bit of an advantage. With the right approach, it’s rather simple.
The concepts I will present here are already built into the black-box ad platforms we use daily, the foundations of which are two closely related assumptions:

  • Any flow of advertising traffic has people behind it whom possess a fixed amount of buying power and a more elastic willingness to exercise it.
  • As individuals we are independent thinkers, but as a swarm, we behave in remarkably predictable ways.

My aim is that one will find the material useful with little more than a bit of Excel and one or two free-ish downloads. The approach is carefully principled, elegantly simple and astonishingly effective.

Achtung! This site makes use of in-browser 3D. If your computer is struggling, then you probably need a little upgrade, a GPU or a browser change. Modern data science needs compute power, and alot of it.

The format is a mix of theory, worked examples and how-to, combined with a touch of spreadsheet engineering. A dear friend of mine – whom has written more than a few articles for the Economist - will be helping me edit things to keep the technical guff to a minimum.

I am hoping along the way that a few interesting people might also compare their own experiences and provide further feedback and refinement. If its well received then we might scale up the complexity.

So, if digital advertising is your game then stay tuned, this will be a bit of fun!

Monday, 16 July 2007

SORTING DATA FRAMES IN R

This is a grandfathered post copied across from my old blog when I was using MovableType (who remembers MovableType?!)

I frequently find myself having to re-order rows of a data.frame based on the levels of an ordered factor in R.

For example, I want to take this data.frame:

       product store sales
        1       a    s1    12
        2       b    s1    24
        3       a    s2    32
        4       c    s2    12
        5       a    s3     9
        6       b    s3     2
        7       c    s3    29
And sort it so that the sales data from the stores with the most sales occur first:
   product store sales
   3       a    s2    32
   4       c    s2    12
   5       a    s3     9
   6       b    s3     2
   7       c    s3    29
   1       a    s1    12
   2       b    s1    24
I keep forgetting the exact semantics of how its done and Google never offers any assistance on the topic, so here is a quick post to get it down once and for all, both for my own benefit and the greater good. First we need some data:
   productSalesByStore = data.frame(
         product = c('a', 'b', 'a', 'c', 'a', 'b', 'c'),
         store = c('s1', 's1', 's2', 's2', 's3', 's3', 's3'),
         sales = c(12, 24, 32, 12, 9, 2, 29)
      )
Now construct a sorted summary of sales by store:
   storeSalesSummary =
         aggregate(
                  productSalesByStore$sales,
                  list(store = productSalesByStore$store),
         sum)
   storeSalesSummary =
      storeSalesSummary[ 
         order(storeSalesSummary$x, decreasing=TRUE), 
         ]
storeSalesSummary should look like this:
   store  x
    2    s2 44
    3    s3 40
    1    s1 36
Use that summary data to construct an ordered factor of store names:
   storesBySales =
      ordered(
         storeSalesSummary$store,
         levels=storeSalesSummary$store
         )
storesBySales is now an ordered factor that looks like this:
      [1] s2 s3 s1
  Levels: s2 < s3 < s1
Re-construct productSalesByStore$store so that it is an ordered factor with the same levels as storesBySales
   productSalesByStore$store =
      ordered(productSalesByStore$store, levels=storesBySales)
Note that neither the contents nor the order of productSalesByStore has changed (yet). Just the datatype of the store column. Finally, we use the implicit ordering of store to generate an explicit permutation of productSalesByStore so that we can sort the rows in a stable manner:
   productSalesByStore = 
      productSalesByStore[ order(productSalesByStore$store), ]
And we are done!