In this post I share a formal framework for reasoning about advertising traffic flows, is how black box optimisers work and needs to be covered before we get into any models. If you are a marketer, then the advertising stuff will be old-hat and if you are a data scientist then the axioms will seem almost obvious.
What is useful is combining this advertising + science view and the interesting conclusions about traffic valuation one can draw from it. The framework is generalised and can be applied to a single placement or to an entire channel.
Creative vs. Data – Who will win?
I should preface by saying my view on creative is that it is more important than the quality of one's analysis and media buying prowess. All the data crunching in the world is not worth a pinch if the proposition is wrong or the execution is poor.
On the other hand, an amazing ad for a great product delivered to just the right people at the perfect moment will set the world on fire.
Problem Description
The digital advertising optimisation problem is well known: analyse the performance data collected to date and find the advertising mix that allocates the budget in such a way that maximises the expected revenue.
This can be divided into three sub-problems: assigning conversion probabilities to each of the advertising opportunities; estimating the financial value of advertising opportunities; and finding the Optimal Media Plan.
The most difficult of these is the assessment of conversion probabilities. Considering only the performance of a single placement or search phrase tends to discard large volumes of otherwise useful data (for example, the performance of closely related keywords or placements). What is required is a technique that makes full use of all the data in calculating these probabilities without double-counting any information.
The Holy Triumvirate of Digital Advertising
In most digital advertising marketplaces, forces are such that traffic with high conversion probability will cost more than traffic with a lower conversion probability (see Figure 1). This is because advertisers are willing to pay a premium for better quality traffic flows while simultaneously avoiding traffic with low conversion probability.
Digital advertising also possesses the property that the incremental cost of traffic increases as an advertiser purchases more traffic from a publisher (see Figure 2). For example, an advertiser might increase the spend on a particular placement by 40%, but it is unlikely that any new deal would generate an additional 40% increase in traffic or sales.


To counter this effect, sophisticated marketers grow their advertising portfolios by expanding into new sites and opportunities (by adding more placements), rather than by paying more for the advertising they already have. This horizontal expansion creates an optimisation problem: given a monthly budget of $x, what allocation of advertising will generate the most sales? This configuration then is the Optimal Media Plan.

To solve the Optimal Media Plan problem, one needs to know three things for every advertising opportunity: the cost of each prospective placement; the expected volume of clicks; and the propensity of the placement to convert clicks into sales (see Figure 3). This Holy Triumvirate of Digital Advertising (cost, volume and propensity) is constrained along a response surface that ensures that low cost, high propensity and high volume placements occur infrequently and without longevity.
For the remainder of this post (and well into the future), propensity will be considered exclusively in terms of ConversionProbability. This post will provide a general framework for this media plan optimisation problem and explore how ConversionProbability relates to search and display advertising.
Background
First lets codify what digital advertising is and the elemental metrics we use each day. If you are already working in this space then you might skip over this section.
Digital Advertising
Digital advertising involves an agreement between advertiser and publisher in which the advertiser purchases highly targeted advertising from the publisher. Ultimately, this agreement drives clickthroughs from the publisher’s website to the advertiser’s website.
This agreement requires that publishers direct users to an advertiser’s website by displaying advertisements. When users click on advertisements, they flow through from the publisher’s website to the advertiser’s website. This flow of users is referred to as traffic.
Once a person is delivered to a website, the goal of the advertiser is to convert them into a customer (with varying degrees of success). The term ‘customer’ is used broadly here and can range from someone purchasing a new DVD player to someone filling in a home loan enquiry form. These quantifiable actions will be referred to as ‘conversion events’ or simply ‘conversions’.
An ad server with integrated post-click tracking technology keeps track of each of these conversions along with details of the publisher and advertisement that referred the conversion to the advertiser’s site. The ad server also records the number of times each ad is viewed and clicked.
The fact that the ad server records where every conversion came from makes digital advertising unique — it is completely accountable, meaning that the return on investment can be calculated for any piece of advertising activity simply by comparing the amount that was spent with the conversions it generated. This accountability has made digital advertising very attractive, resulting in numerous marketplaces in which traffic is actively traded.
Advertisers can pay publishers for traffic in a number of ways, the most common being cost per impression (CPM), cost per click (CPC) and cost per action (CPA). With CPM advertising, the advertiser pays the publisher a fee every time one of their advertisements is displayed to a user; for CPC advertising, the advertiser pays the publisher whenever a user clicks on an advertisement; and for CPA advertising, the advertiser pays the publisher whenever a conversion event occurs.
Digital advertising can be broadly divided into two classes: Display and Search. Display advertising involves the now classic banner advertisement format (and all its derivatives), which is typically sold on a CPM, CPC or CPA basis. Search is a text-based format that appears alongside search engine results and is only sold on a CPC basis.
For more information about digital advertising see Arens et al. [Arens 07].Display Advertising
Everyone has seen the now ubiquitous banner advertisements (display advertising) that cover much of the web. Advertisers utilise display advertising not only to drive clickthrough traffic and conversions to their site, but also to imprint their brand and their message into the minds and hearts of consumers. The former is known as direct response advertising, the latter is branding.
A report by ComScore [Fulgoni 08] found that, unlike search advertising, users respond in a variety of ways to display advertising and that does not always include a clickthrough. A consumer may respond by visiting the advertiser’s website, conducting a search query using the advertiser’s branded terms, buying the advertised products online or visiting the advertiser’s retail store. For the purposes of simplicity, in this post the view of display advertising will be constrained to direct response activity; that is, to display advertising run by an advertiser purely to generate conversions. In later posts, I will cover how this framework generalises far beyond just clicks.
Display advertising (or just Display), comes in a variety of sizes standardised by the IAB [iab 09]. A display advertisement can be a static image, an animated image, Flash-based rich media (which may include audio and interactivity) or video.

Figure 4: Display Advertising on slate.com
Search Advertising
Advertisers promote their products and services through search advertising by purchasing clickthrough traffic from search engines such as Google, Yahoo and Bing. Advertising messages are targeted to the entered search phrase and if a user clicks on an ad, the advertiser pays a fee to the search engine or publisher. Search advertising is also known as search engine marketing (SEM), paid search or simply Search.
Search is particularly good at converting because it delivers a customised offer, tailored to the current context and disposition of the user. Unfortunately, Search suffers from a lack of volume in highly targeted domains. It also lacks branding value due to the textual ad format.
To participate in Search, advertisers must supply to the search engine a keyword portfolio consisting of:
- one or more textual advertisements;
- a set of search phrases they would like their ads to appear alongside;
- an associated bid vector specifying the maximum bid price for each phrase; and
- a daily budget limit.
The search engine then operates a closed marketplace in which the CPC rate is determined in real-time based on the current supply of clicks for each search phrase and the associated demand by advertisers for those clicks. Demand for any given search phrase is a function of all participating advertiser’s maximum bids.
For an introduction to search advertising, see Cho [Cho 05]. For a detailed background on search advertising from a computer science perspective see Cristo [Cristo 06].

Figure 5: Search Advertising on google.com. Notice here that a variety of related advertisements have been displayed in response to the user’s search for ‘cheap accommodation’.
The Elements of Traffic
A placement is the positioning and location of an advertisement within a website. In the case of Search, a placement is generally a search phrase. For Display, the placements available on a site are dependant on the information architecture and visual design of the site upon which the placement exists. A campaign is an organised program of advertising consisting of advertisements displayed in a variety of placements across numerous publishers’ websites. Once a campaign is launched, an ad server captures information about the performance of every advertiser, publisher and placement. Various metrics and ratios are then used to analyse this data so that advertisers can ascertain the performance of their campaign. The following three sub-sections will briefly cover the most common metrics and ratios in use today.Additive Metrics
Ad servers capture and log advertising activity, then process the logs to extract five additive metrics. The metrics are:
| Impressions | An impression is a single user looking at an advertisement once. The nature of the internet allows an ad server to track how many times an ad is served to an individual computer. One assumes that each time an ad is served it is viewed by a person; Therefore, the total number of impressions is simply the number of times the ad has been served. |
| Clicks | is the total number of clicks on an advertisement. If a user decides to click on an advertisement, then that clickthrough is counted as a single click. Obviously, an impression must occur prior to a clickthrough occurring; therefore the total number of impressions will always be greater than or equal to the number of clicks. |
| Cost | is the amount paid by an advertiser to a publisher for an advertisement. Cost is generally agreed between publisher and advertiser in advance and calculated on a per-impression, per-click or per-action basis. |
| Actions | or conversions are the total number of quantifiable results that have resulted from an advertisement. A conversion occurs when a prospective customer takes an advertiser’s intended action. For example, filling in a home loan application, signing a petition, or subscribing to an e-zine are all examples of actions. Actions are tracked by the ad server by placing a 1x1 pixel on the last page at the end of the sales process. |
| Revenue | is the total amount of revenue generated from an advertisement. Generally this revenue data is supplied to the ad server using the same 1x1 pixel that is used to track actions. |
Calculated Ratios
Advertisers construct a variety of ratios from the five basic metrics. Ratios provide a deeper understanding of an advertising campaign because they allow an advertiser to compare normalised performance of different placements, advertisements and publishers. The most common ratios in use are:| CTR | Click Through Rate represents the proportion of ads that are clicked on or an estimate of the
probability that someone will click on an ad. It is calculated as
$CTR=\frac{Clicks}{Impressions}$ |
| ConversionProbability | is the proportion of clicks that result in actions (i.e. conversion). It is estimated as
$ConversionProbability\approx\frac{Actions}{Clicks}$ |
| CPM | Cost per Mille represents the cost per thousand ad impressions and is calculated as
$CPM=\frac{1000 \cdot Cost}{Impressions}$ |
| CPC | Cost per Click is the amount paid for each ad clickthrough. It is calculated as
$CPC=\frac{Cost}{Clicks}$ |
| CPA | Cost per Action is the average amount paid for each quantifiable action generated
by a piece of advertising. It is calculated as
$CPA=\frac{Cost}{Actions}$ |
| RPC | Revenue per Click is the average amount of revenue generated by each ad clickthrough
for the advertiser. It is calculated as
$RPC=\frac{Revenue}{Clicks}$ |
| ROAS | Return on Ad Spend is the expected return for each dollar spent on advertising
where ROAS = 100% is parity and ROAS > 100% is a profitable campaign. It is
calculated as
$ROAS = \frac{Revenue}{Cost} = \frac{RPC}{CPC} = \frac{ARPU}{CPA}$ |
| ARPU | Average Revenue Per Unit is the expected revenue generated by each quantifiable
action. It is calculated as
$ARPU=\frac{Revenue}{Actions}$ |
| ROMI | Return on Marketing Investment. See ROAS. |
In the following section, ROAS will be used to derive two important axioms of traffic: the Revenue Axiom and the Return Axiom.
Known Metrics
The previous metrics come from ad-serving data and thus are sourced externally from various technology platforms. In addition, a campaign manager 'knows' the following and chooses whether to share this information with publishers. Justification for sharing this confidential data ranges from strategic goals through to technical requirements.
| Media Budget | The total estimated ad spend for a collection of media placements. Usually set on a monthly, quarterly or yearly basis and monitored on a daily, weekly or monthly basis. |
| Sales Forecast | The predicted sales (Actions) and/or Revenue expected to be generated from the allocated Budget. |
| Target CPA | Desired (rather than actual) CPA. see CPA. |
| Action Valuation | the business' underlying valuation of a single conversion in dollars. Closely related to ARPU and CPA Valuation. |
| CPC/CPM/CPA Bid | The offer amount entered into an advertising marketplace to purchase traffic flows. Price is for a single click, 1000 impressions or a single action respectively. Closely related to CPC/CPM/CPA Valuation. |
| CPC/CPM/CPA Valuation | The expected utility (expressed in dollars) that an advertiser predicts they will receive for a single click, 1000 impressions or a single action respectively. Closely related to CPC/CPM/CPA Bid. |
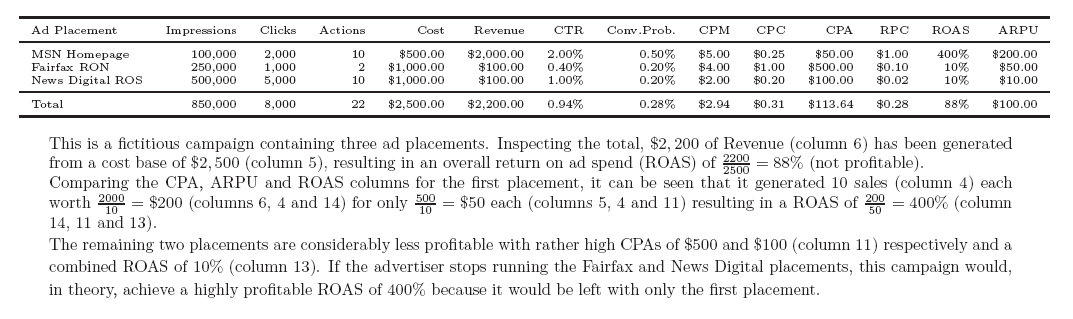
Figure 6: An example of using standard metrics & ratio analysis to quantify performance of a campaign.
Return and Revenue Axioms
Rational advertisers are interested in maximising return (ROAS) and/or revenue. This section uses definitions from the previous one to derive the component parts of ROAS and revenue. This formulation allows an advertiser to manipulate return and revenue by varying a single component while holding the others constant.
An obvious extension (that is beyond the scope of this post) is to incorporate impressions and CTR into the Return and Revenue Axioms. Softer metrics such as email opens and social likes may also be incorporated using the same principles – I might cover that separately in a future post. For now lets keep things simple.
Return Axiom of Traffic
The basic ratios described in the previous section can be used to derive the component parts of ROAS into something we can work with:
$\begin{align*}ROAS&=\frac{Revenue}{Cost}\\&=\frac{ARPU \cdot Actions}{CPC \cdot Clicks}\\&=ARPU \cdot ConversionProbability \cdot CPC^{-1}&&\hspace{20 mm}(1)\end{align*}$
Which leads us to this tidy 1st axiom of traffic called the Return Axiom:
$\boxed{ROAS = \underbrace{ARPU}_{\mbox{\tiny offer}} \cdot \underbrace{ConversionProbability}_{\mbox{\tiny ads/traffic}} \cdot \underbrace{CPC^{-1}}_{\mbox{\tiny traffic price}}}$
This 3-part multiplicative arrangement of ROAS is a mathy way of saying: if an advertiser wants to increase ROAS, they must increase ARPU by changing the offer and/or the site that the offer is on, increase ConversionProbability by choosing better ads and/or traffic sources, or reduce CPC by changing bids or re-negotiating the price of deals.
Neat.
Revenue Axiom of Traffic
Some advertisers are more concerned with generating overall revenue or sales volume than with increasing return. For these, one must consider what goes into generating revenue. To work that out swizzle around the Return Axiom to incorporate the definition of CPC, as follows:
$\begin{align*}ROAS&=ARPU \cdot ConversionProbability \cdot CPC^{-1}\\&=\frac{ARPU \cdot ConversionProbability \cdot Clicks}{Cost}\\&=\frac{Revenue}{Cost}\\\implies&Revenue = ARPU \cdot ConversionProbability \cdot Clicks&&\hspace{20 mm}(2)\end{align*}$
Which spits out this elegant 2nd axiom of traffic called the Revenue Axiom:
$\boxed{Revenue = \underbrace{ARPU}_{\mbox{\tiny offer}}\cdot\underbrace{ConversionProbability}_{\mbox{\tiny ads/traffic}}\cdot\underbrace{Clicks}_{\mbox{\tiny traffic volume}} }$
Again, we have a 3-part multiplicative arrangement that is almost the same, but now traffic price has been replaced with traffic volume. Specifically, what the above now says is: if an advertiser wants to increase Revenue, they must increase ARPU by changing the offer and/or the site that the offer is on; increase ConversionProbability by choosing better ads and/or traffic sources; or increase the volume of Clicks by increasing spend, increasing bids or re-negotiating deals.
The Optimal Media Plan
This next bit gets into some math which can be skipped on first reading. The take-out is that the Revenue Axiom (which is applicable to a single placement) can be plugged into a bigger calculation over every placement in a media plan to optimise the total revenue generated by that media plan. This is fundamentally how the black box optimisers work.
Borrowing from the optimisation framework described by Özlük and Cholette [Özlük 07], the media plan optimisation problem is defined as follows.
Maximise the Objective Function:
$\begin{align*}\underset{\vec{B}}{\operatorname{argmax}}\left[Revenue=\sum_{i=1}^N ARPU_i \cdot \widehat{p_i}\cdot\widehat{clicks_i}(bid_i \in \vec{B})\right]&&\hspace{20 mm}(3)\end{align*}$
Subject to:
$\begin{align*}bid_i & \ge 0 &&\text{positive bids}\\\sum_{i=1}^N clicks_i \cdot bid_i & \le d&&\text{budget constraint}\end{align*}$
Where:
$\begin{align*}N&\text{ total number of placements under consideration}\\d&\text{ total budget for media plan}\\i&\text{ placement index s.t. }0 \leq i \leq N\\clicks_i&\text{ clicks observed for placement i}\\\widehat{clicks_i}(bid_i)&\text{ clicks predicted for placement i given a bid of }bid_i\text{. This should be a monotonically}\\&\text{ increasing function.}\\actions_i&\text{ actions observed for placement i}\\p_i&\text{ actual conversion probability for placement i s.t. }p_i=\lim_{clicks_i\to\infty}\frac{actions_i}{clicks_i}\\\widehat{p_i}&\text{ predicted conversion probability for placement i s.t. }\widehat{p_i}\approx p_i\\\widehat{\vec{P}}&\text{ is the conversion probability vector s.t. }\widehat{p_i} \in \widehat{\vec{P}}\\bid_i&\text{ bid associated with placement i}\\\vec{B}&\text{ is the bid vector s.t. } bid_i \in \vec{B}\\ARPU_i&\text{ is the average revenue per unit (ARPU) associated with placement i}\end{align*}$
Of special note is that the Objective Function (3) contains the Revenue Axiom (2), where:
$\begin{align*}ARPU_i&\quad\text{is ARPU}\\\widehat{p_i}&\quad\text{is ConversionProbability}\\clicks_i&\quad\text{is Clicks}\\\end{align*}$
Looking back to the Holy Triumvirate of Digital Advertising, the Objective Function (3) also contains:
$\begin{align*}\widehat{clicks_i}(bid_i \in \vec{B})&\quad\text{the Volume}\\\widehat{p_i}&\quad\text{the Propensity}\\bid_i \in \vec{B}&\quad\text{the Cost}\\\end{align*}$
The Return Axiom (Equation 1) was not used in the Objective Function (Equation 3) because the budget constraint $\color{white}d$ effectively makes this optimisation of revenue given a fixed budget, and thus the outcome is the same (optimising ROAS). Unlike Ozluk's optimisation framework, CTR and impressions have not been included here. If you are bidding on a CPC basis, you don't need it. I may cover this extension in a further post, but it's straightforward.
Now, given that:
- $\color{white}d$ is known $\color{white}\emph{a priori}$ from the media plan;
- the bid vector $\color{white}\vec{B}$ is a function of the conversion probability vector $\color{white}\widehat{\vec{P}}$ simply because when the probability is high, the bid is high (and vice versa);
- the advertising network provides the data required for the function $\color{white}\widehat{clicks_i}(bid_i)$;
- much of the Volume, Propensity and Cost data in the response surface is unobservable or only partially observable $\color{white}\emph{a posteriori}$; and
- if we could observe the response surface then one could easily use any of a number of solvers to 'solve' the optimisation problem
Attention will focus purely on the remaining parameter – accurate estimation of the ConversionProbability vector $\color{white}\widehat{\vec{P}}$.
So what is Conversion Probability?
The conversion probability $\color{white}\widehat{p_i}$ is an interesting beast. When I refer to $\color{white}\widehat{p_i}$ or just ConversionProbability, what I am referring to is the probability that an Action will occur given that a user has clicked on an ad in placement $\color{white}i$. More formally, this is:
$\widehat{p_i}=P(Action=TRUE|click_i=TRUE)$
In reality, other "stuff" can influence $\color{white}\widehat{p_i}$, for example, time of day, colour of the ad, social sentiment, TVC TARPs, email sends or today's weather. Particularly important is that one has seen an ad (ie, an ad impression). Let's incorporate $\color{white}impression_i$ for the viewing of an ad then call that other stuff "$\color{white}\cdots$" By extension, what we now have is:
$\widehat{p_i}=P(Action=TRUE|click_i=TRUE, impression_i=TRUE,\cdots)$
id est, the ConversionProbability for placement $\color{white}i$ is the probability that an action occurs ( $\color{white}Action=TRUE$), conditioned on ( $\color{white}|$) a click on a particular placement ( $\color{white}click_i$), an impression of an ad inserted into the same placement ( $\color{white}impression_i$), and a bunch of other stuff ( $\color{white}\cdots$)
Incorporating that "stuff" into this framework allows one to beat the market by considering more than just clicks & conversions. In future posts I will cover some neat tricks to quantify that magical 'stuff'.
Notice that I keep putting a hat on top of my $\color{white}\widehat{p_i}$. This hat is my own personal 'bayesian' estimate using whatever "stuff" I have lying around. This is a very different number to the un-hatted classical 'frequentist' $\color{white}p_i$, which I tend not to use directly but rather incorporate into my $\color{white}\widehat{p_i}$ – more on why and how later. For now, let us stay focused on what a ConversionProbability is, why they are difficult and how they are useful.
See [Tsitsiklis 10] for more on probabilistic reasoning. An over-simplified takeaway is that probabilities are multiplicative (they can be multiplied to get the answer you want) while expected values are additive (just sum them together).
Difficulties in Assessing Conversion Probabilities
To calculate the optimal bid vector, one must accurately estimate their $\color{white}\widehat{p_i}$ for each ad placement. This is not always simple.
Figure 7 lists a selection of placements from a fictitious marketing campaign. The conversion probability $\color{white}\widehat{p_i}$ has been estimated from the relative frequency, that is actions over clicks. Notice that the more targeted 'long tail' activity attracts fewer clicks but has a higher conversion rate. The lack of volume makes estimation of conversion probabilities for these placements difficult. From this example, the conversion ratio for 'MSN Behavioural Targeting' could be anywhere between 2.66% and 16.26%, while for 'Fairfax Behavioural Targeting' the lack of a conversion from the four clicks does not allow one to make any estimation yet.

Figure 7: ConversionProbability or $\color{white}\widehat{p_i}$ is difficult to estimate for low volume activity
The problem is that the data available for the placements 'MSN Behavioural Targeting' and 'Fairfax Behavioural Targeting' is insufficient to reliably estimate the conversion probability of the placement.
To put it into perspective, if the aim of a frequentist is to be 95% confident that the estimated ConversionProbability is within 1% of the estimate and assuming 5% average conversion probability, one requires 1285 clicks on every placement. For many high targeting placements or long tail search keywords, that volume may take months or even years to accrue. This is the curse of the long tail (see Figure 8).

Figure 8: Pareto chart of long tail search phrases from a home loan campaign
This difficulty is further compounded because conversion probabilities are by their very nature much closer to zero than to one. Conversion events occur infrequently resulting in very sparse data where it matters the most.
What is required is an accurate method to estimate the ConversionProbability for a placement based on everything known about a placement, including what is known about placements that are related to it; that is, to calculate long tail conversion probabilities, all of the data or evidence that is available must be used.
Calculating Traffic Valuation from Conversion Probability
The valuation ideas presented in this section provide a theoretical understanding of how to apply $\color{white}\widehat{p_i}$ (or $\color{white}\widehat{\vec{P}}$) in a practical setting. Applied examples follow below.
Actions or conversion events have an underlying valuation to the business. Traffic flows from any placement is expected to convert into actions and generate revenue. The average revenue associated with those actions can be used to assess the value of a placement (on a CPC basis) by simply multiplying the underlying valuation and the conversion probability, as follows:
$\begin{align*}CPC Valuation_i&= E[action|click_i]\\&=ARPU \cdot P(action|click_i,\cdots) \\&=ARPU \cdot \widehat{p_i}&&\hspace{20 mm}(4)\\\end{align*}$
The formula $\color{white}E[\enskip]$ in the above refers to the "expected value". Think of it as what you would make on average if you did whatever is described in the square brackets many times over. In the case of a CPCValuation for some placement, it's expected value is the average revenue you would expect to receive for each click.
In the last line there (Equation 4), the rules for calculating expected values have been used to derive the CPCValuation for placement $\color{white}i$ using the ARPU as my underlying action valuation and my $\color{white}\widehat{p_i}$ as the conversion probability for that particular placement.
For the sake of completeness, lets extend Equation 4 for the CPA & CPM valuation scenarios:
$\begin{align*}CPA Valuation_i&= E[action]\\&=ARPU\\\\CPM Valuation_i&= E[action|impression_i] \cdot 1000\\&=ARPU \cdot P(action|impression_i,\cdots) \cdot 1000\end{align*}$
Rationality and its impact on Traffic Valuations
An advertiser's basis of their CPC bid ($\color{white}bid_i$), is their valuation. If you are profit seeking, your $\color{white}bid_i$ is lower than your CPCValuation, if you are volume seeking then your $\color{white}bid_i$ will be higher than your CPCValuation.
Rational advertisers bid less than their CPCValuation, while less rational advertisers bid more. My view is that one should bid what the traffic is worth (i.e. their CPCValuation) then allow the creative & brand effects to work their magic. Your view might be different.
A rational advertiser is one that has a positive expected ROAS; that is, the advertiser prefers campaigns with advertising revenues that exceed the cost of the advertising. If an advertiser is acting rationally, then the following is true:
$\forall i \in {1...N} : ARPU\cdot\widehat{p_i} \ge bid_i$
In the above relation $\color{white}ARPU \cdot \widehat{p_i}$ is the CPCValuation, or the estimated revenue per-click of the traffic to placement $\color{white}i$ (per Equation 4). If an advertiser is behaving rationally, then their per-click bid ( $\color{white}bid_i$) should not exceed their per-click revenue. Another way of considering this is in terms of the advertiser's TargetCPA. One could argue that $\color{white}bid_i$ is really $\color{white}Target CPA \cdot \widehat{p_i}$ and so conclude that:
$ARPU \ge TargetCPA$
One must also consider advertisers with an ARPU below their TargetCPA. These advertisers are not behaving rationally and they are in plentiful supply. For example, an advertiser might value the branding aspect of digital advertising over and above the revenue generated directly from it; other advertisers must reach sales targets regardless of the price; and many simply have not tracked conversions or optimised their campaigns. If an advertiser is behaving irrationally, the following relations are true:
$\forall i \in {1...N} : ARPU\cdot\widehat{p_i} < bid_i$
$ARPU < TargetCPA$
Given that rationality can have such a dramatic effect on bidding, an advertiser's risk preferences and their associated utility function are an important and often overlooked aspect of campaign planning. For more information about utility functions and risk preferences from a Bayesian perspective, refer to Winkler's Book [Winkler 03] and Marshall et al. [Marshall 95].
What Drives Advertising Market Efficiency?
My conjecture is that if one calculates the average ARPU and the average TargetCPA over every currently active advertiser (within a digital advertising marketplace), the two averages will be close to equal. This is because ARPU and TargetCPA are estimating the same thing: the business' underlying valuation of a single conversion. If this is assumed to be true, then the following is also true:
$ARPU \equiv TargetCPA \equiv ActionValuation\hspace{20 mm}(5)$
This equivalence allows an advertiser to use ARPU in place of the ActionValuation in Equation 4, and makes the practical calculation of CPCValuation easy. The basis for this equivalence is straightforward: rational advertisers will cause their campaigns to converge towards an optimal point that maximises conversion volume without exceeding their financial means. If Equation 5 is not satisfied over the long run, then a business will fail (due to losses) or its growth will slow (due to profit taking).
This advertiser behaviour feeds into the various marketplaces and influences both the price of the media and the distribution of quality conversion generating ad inventories amongst advertisers (see the Holy Triumvirate of Digital Advertising above). The author has noticed that at high volumes, it is more difficult (but far from impossible) to exceed parity for many campaigns. This indicates that some sort of market equilibrium is in effect, even though multiple advertisers (with differing products and offers) arrive at different valuations for the same ad placement (and its associated traffic flows). Thus, the true CPCValuation of a placement (which is estimated by an advertiser with Equation 4), transcends all advertisers and is actually an intrinsic property of the ad placement.
Traffic Valuation by Example
Lets make this more concrete with an example. Assume the traffic in Figure 7 refers to an insurance company with three products (car, home and health insurance) and that a good estimate of ConversionProbability is simply $\color{white}p_i$ (without the hat).
First assess ARPU for each of the three products:

Once we have our ARPUs, Equation 4 can be used to calculate our CPMValuation and CPCValuation for each placement (columns 10 and 11 respectively):

The values in columns 10 and 11 can now be used to calculate bids. In media buying marketplaces that use a Vickrey/GSP auction to set price (eg, Google Adwords) use these numbers directly for bidding (David Easley [Easley 10] has written a lucid summary on why). If not, then a less truthful bidding strategy might be required.
The calculations in Figure 10 use a simplified version of Equation 4 (see excel example). Direct application is as follows:
$\begin{align*}CPCValuation_1&=\textdollar 50\left(\frac{120}{3159}\right)+\textdollar 20\left(\frac{77}{3159}\right)+\textdollar 5\left(\frac{10}{3159} \right )=\textdollar 2.40\\CPMValuation_2&=\textdollar 50\left(\frac{1}{30000}\right)1000+\textdollar 20\left(\frac{4}{30000}\right)1000+\textdollar 5\left(\frac{6}{30000} \right )1000=\textdollar 5.33\end{align*}$
Easy to execute with a firmly grounded theoretical basis.
If you are using an automated bidding engine, do these calculations to sense check what it is doing. You might be surprised by the risks it is taking!
What has been solved here?
- CPM/CPC bidding and revenue reporting are now obviously easier. For example, in the above the first placement ('MSN Run of Network') has the lowest CTR and ConversionProbability, yet has the highest CPCValuation because it drives profitability.
- More subtle is that we now have a systematic approach to calculate what each placement is worth in such a way that an advertiser can make a conscious decision to upweight or downweight bidding with the knowledge that they are respectively seeking or avoiding risk by doing so.
- Finally, we have avoided the need for an optimiser by offloading the task back onto the publishers. If the probabilities are good and risk preferences are properly calibrated & incorporated, then one shouldn't care too much which placements deliver more traffic as they should all deliver similar risk-adjusted ROAS.
What hasn't been solved (yet)?
- The curse of the long tail still exists here. Techniques designed to mesh together data will be introduced in the next post to solve this exact problem by calculating ConversionProbabilities that are better at predicting outcomes and less affected by sparse data.
- Risk preferences are loosely defined right now. In the subsequent post I will present a quantitative method for adjusting CPC Bids up or down according to one's current risk appetite.
- There is no mention of 'media attribution' or 'customer segmentation' in the above. With the right "stuff", this approach can be applied in reverse to solve those problems without drowning oneself in logfiles, universal identifiers or cross-device madness.
By the end of this three part series, a complete example of a straightforward bidding engine
will be provided that requires nothing more than Excel (the first version is here).
References
| [Arens 07] | William F. Arens, Michael F. Weigold & Christian Arens. Contemporary Advertising. McGraw-Hill/Irwin, 11th edition, 2007. |
| [Cho 05] | Michael Cho, Andrew Iskandar, Sanjay Kidambi, Steve Shepherd & Cuong Do Tuan Vuong. Search-based Online Advertising. Rapport technique, UC Berkeley School of Information, 2005. http://people.ischool.berkeley.edu/~hal/Courses/StratTech07/Tech/Tech05/C-report.doc. |
| [Cristo 06] | Marco Cristo, Berthier Ribeiro-Neto, Paulo B. Golgher & Edleno Silva de Moura. Search Advertising, pages 259–285. Studies in Fuzziness and Soft Computing. Springer Berlin / Heidelberg, 2006. |
| [Easley 10] | David Easley and Jon Kleinberg Networks, Crowds, and Markets: Reasoning About a Highly Connected World, chapter 15, Sponsored Search Markets Cambridge University Press, 2010. |
| [Fulgoni 08] | Gian M. Fulgoni & Marie Pauline Mörn. How Online Advertising Works: Whither the Click? From Empirical Generalizations in Advertising Conference for Industry and Academia, http://www.comscore.com/Press_Events/Presentations_Whitepapers/2008/ How_Online_Advertising_Works_Whither_The_Click, December 2008. comScore, Inc. & The Ehrenberg-Bass Institute for Marketing Science. |
| [IAB 09] | Ad Unit Guidelines. http://www.iab.net/iab_products_and_industry_services/1421/1443/1452, 2009. |
| [Marshall 95] | Kneale T. Marshall & Robert M. Oliver. Decision Making and Forecasting, Chapter 6 (Subjective Measures and Utility). McGraw-Hill, 1995. |
| [Özlük 07] | Özgür Özlük & Susan Cholette. Allocating expenditures across key- words in search advertising. Journal of Revenue and Pricing Management, no. 4, pages 347–356, 2007. |
| [Tsitsiklis 10] | Tsitsiklis, John. 6.041 Probabilistic Systems Analysis and Applied Probability, Fall 2010. (MIT OpenCourseWare: Massachusetts Institute of Technology), http://ocw.mit.edu/courses/electrical-engineering-and-computer-science/6-041-probabilistic-systems-analysis-and-applied-probability-fall-2010 (Accessed 15 Jul, 2014). License: Creative Commons BY-NC-SA |
| [Winkler 03] | Robert L. Winkler. Bayesian Inference and Decision, chapter 5 section 6, The Assessment of Utility Functions. McGraw-Hill, 2nd edition, 2003. |
No comments:
Post a Comment